- Help & Support
-
 EN
EN
-

Location
United States of America

Forex Basics
What is a Pin Bar Candlestick? Trading Strategy Explained
 313
313
 19-06-2026
By: Exclusive Markets
19-06-2026
By: Exclusive Markets

Table of Content
- What is a Pin Bar Candlestick?
- What are the Characteristics of a Valid Pin Bar Candlestick Pattern?
- How Traders Approach the Pin Bar Trading Strategy
- How to Apply the Pin Bar Reversal Strategy?
- Factors Traders Often Consider When Evaluating Pin Bar Formations
- Advantages of the Pin Bar Trading Strategy
- Limitations of the Pin Bar Trading Strategy
- Conclusion
In forex trading, traders use different patterns to understand price behaviour. One of them is the pin bar candlestick. It is a single-candle pattern that may indicate price rejection at a certain level, suggesting a reversal is forming.
This guide explains the structure of the pin bar and how traders apply it in real market conditions. It also looks at where the pattern tends to work best and what to keep in mind when managing risk.
What is a Pin Bar Candlestick?
A pin bar candlestick is a single price bar that may indicate rejection at a key level on the chart. The term comes from "Pinocchio bar." The long tail, much like Pinocchio's nose, shows where the market attempted to move but could not sustain that direction.
In price action trading, the pin bar is one of the more straightforward patterns to work with. It does not rely on indicators or complex calculations. When the market moves toward a level but fails to maintain momentum in that direction, the resulting price rejection appears as a long tail on the chart. This is what makes the pin bar candlestick a useful reference point for traders who closely follow price behaviour.
Anatomy of Pin Bar
The pin bar candlestick pattern has three parts:
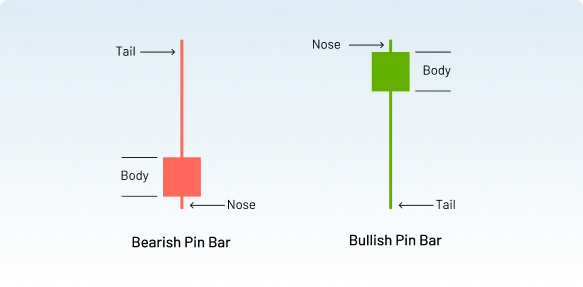
- Tail (wick or shadow): The long, extended part of the candle. It represents the price level that was tested but not sustained. A longer tail is often interpreted by traders as reflecting a more pronounced rejection of that price level.
- Body: The small section between the open and close prices of the candle. A smaller body is often viewed by traders as an additional characteristic of a well-defined pin bar, as it shows that the price returned close to where it started.
- Nose: The short end of the candle that sits opposite the tail. It represents the side of the market that held firm during the session.
Many traders consider a pin bar to be more clearly defined when the tail covers at least two-thirds of the total candle length. The body should sit toward one end of the candle, and the open and close prices should remain close together. When these characteristics align, it may suggest that the price was not sustained at that level.
Types of Pin Bars
There are two types of pin bar formations:
Bullish Pin Bar
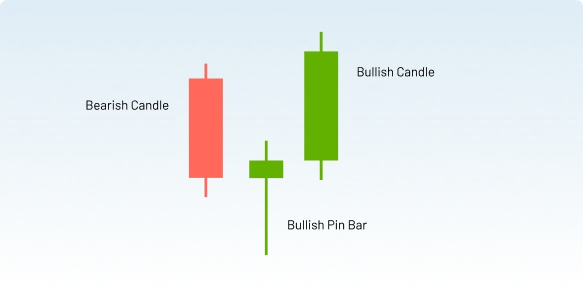
A bullish pin bar has a long lower tail. It forms when the price drops sharply during the session but then recovers and closes near the top of the candle. Some traders interpret this as an indication that buyers were active at those lower levels, which may push the price higher. It commonly appears at the bottom of a downtrend or near a support level.
The longer the lower tail and the smaller the body, the more the pattern may reflect increased buying interest at that level. When this formation appears at a well-known support zone, many traders view it as a pattern that may warrant further analysis, particularly when supported by additional market context.
Bearish Pin Bar
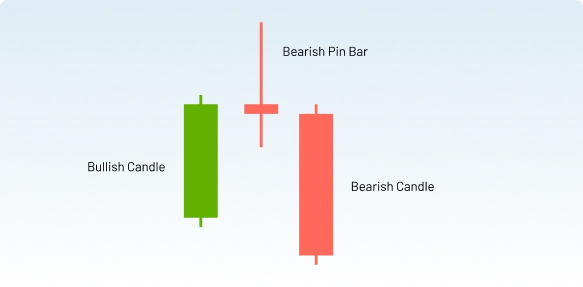
A bearish pin bar has a long upper tail. It forms when the price rises during the session but then falls back and closes near the bottom of the candle. This may indicate that sellers were active at those higher levels and did not allow the price to hold. It usually appears at the top of an uptrend or near a resistance zone.
Traders often observe that a pin bar may signal a potential move in the direction opposite to its tail, as the tail reflects an area where price was unable to sustain its movement. A downward tail may suggest a potential move upward, while an upward tail may suggest a potential move downward.
What Are the Characteristics of a Valid Pin Bar Candlestick Pattern?
Not every long-tailed candle can be considered a valid pin bar. Each characteristic of the pattern plays a role in determining whether it meets the general criteria that traders look for.
A pin bar is generally considered more clearly defined when it has the following characteristics:
- Tail length: The tail should be at least twice the length of the body, ideally covering two-thirds or more of the full candle.
- Body position: The body should sit near one end of the candle, close to the nose, not in the middle.
- Open and close proximity: These two prices should be very close to each other. A smaller body may be viewed as an additional characteristic of a well-defined pin bar.
- Tail protrusion: The tail should stick out clearly from the candles around it. If it blends into nearby bars, it is generally considered less significant.
- Chart location: Where the pin bar forms matters as much as how it looks. Traders often consider the location of a pin bar important when evaluating its relevance within the broader market context.
A pin bar can sometimes look similar to a doji or a hanging man candle. However, these are distinct patterns that reflect different market conditions and should not be treated as interchangeable.
How Traders Approach the Pin Bar Trading Strategy
In the pin bar trading strategy, traders often look at the broader market context before acting on the pattern. They can consider the chart location, trend direction, and time frame. Each of these factors may influence how the pattern is analysed.
A pin bar forming at a random spot on the chart with no supporting context is generally considered less significant. On the other hand, a pin bar appearing at a key support or resistance level, in line with the dominant trend on a higher time frame, may be considered more relevant by some traders.
When multiple conditions support the same pattern, this is referred to as confluence. Some traders choose to place greater emphasis on pin bar formations that appear alongside other technical factors rather than interpreting the pin bar candlestick in isolation.
How to Apply the Pin Bar Reversal Strategy?
Once a pin bar is identified, traders generally use one of three entry approaches. Each has its own trade-offs in terms of timing and risk management.
1. Market Entry
The trader enters at the current market price as soon as the pin bar fully closes. In this approach, a bullish pin bar may lead a trader to consider a buy order, while a bearish pin bar may lead them to consider a sell order. Therefore, this method reduces the risk of missing the move after the candle closes.
2. Stop Entry
A buy stop is placed just above the high of a bullish pin bar, while a sell stop is placed just below the low of a bearish pin bar. If the price does not move in the anticipated direction, the trade does not activate. This approach requires the market to move in the expected direction before a position is opened, which some traders consider a preferred way to enter the market.
3. Limit Entry at 50% Retracement
After a pin bar closes, the price sometimes pulls back to around the midpoint of the candle before continuing. Placing a limit order at this 50% level may allow traders to define their stop loss levels differently and could alter the potential risk-to-reward profile of the trade. This approach tends to work more applicable on pin bars with longer tails.
Factors Traders Often Consider When Evaluating Pin Bar Formations
The position of a pin bar on the chart is one of the factors traders consider when assessing the setup. Some of the conditions where it tends to be most effective include:
- At key support and resistance levels: When a pin bar forms at a support or resistance level that has been previously tested, some traders consider it more significant. These are levels where the market has previously reacted, and a pin bar appearing there may be seen as further evidence that the price was not sustained at that point.
- In a trending market: Some traders place greater emphasis on pin bars that form in the direction of the prevailing trend. In an uptrend, a bullish pin bar at a support level after a pullback may indicate that upward momentum is continuing. In a downtrend, a bearish pin bar near resistance may suggest the downward move is still in play.
- At moving average levels: Many traders watch the 8 and 21-period exponential moving averages on the daily chart. A pin bar forming at one of these levels may add another layer of confirmation to the setup.
- On higher time frames: Pin bars on the daily and 4-hour charts are generally considered more reliable than those on shorter time frames. Lower time frames produce more noise, and many pin-bar-shaped candles on a 5-minute chart may not carry meaningful signals.
Advantages of the Pin Bar Trading Strategy
Some of the potential advantages of this approach include:
- Simple to identify: The pin bar candlestick pattern has a clear visual structure. It does not require multiple indicators or complex calculations to spot on a chart.
- Works across markets: A pin bar may appear in forex, indices, commodities, and other markets, making it a broadly applicable tool for price action traders.
- Clear reference points for risk management: The tail of the pin bar provides a natural level for stop loss placement, which may support more structured risk management.
- Flexible entry options: A pin bar setup can be approached in more than one way. Some traders prefer market entry, others use stop entry, and some opt for a limit order at the 50% retracement level. This may depend on individual risk tolerance and trading style.
- Applicable in both trending and range-bound markets: The pin bar reversal strategy can be used when following a trend or at key turning points in a ranging market.
Limitations of the Pin Bar Trading Strategy
While the pin bar trading strategy may offer a structured approach, it also comes with limitations that traders should be aware of:
- Not every pin bar leads to a reversal: The pattern reflects a rejection of price, but it does not guarantee that prices will continue moving in a particular direction. Market conditions can change quickly.
- Context is essential: A pin bar forming without a clear support, resistance, or trend context carries less analytical significance. Trading it in isolation may increase the risk of false signals.
- Lower-time-frame noise: On shorter time frames, pin bar-shaped candles appear frequently. Many of these do not carry the same significance as those on the daily or 4-hour chart.
- Requires patience: Clear setups do not appear constantly. Traders often need to wait for the pattern to form at the right location, which requires discipline and a willingness to stay out of the market when conditions are not clear.
- Risk remains: Even a well-placed pin bar at key levels can fail. Unexpected news events or shifts in market sentiment can impact technical signals without warning.
Conclusion
The pin bar trading strategy offers traders a structured way to interpret price rejection and identify potential reversals. Therefore, it is important to recognise a valid pin bar candlestick pattern and pair it with the right market context. This can help traders make more informed decisions in both trending and range-bound conditions.
No strategy comes with promised results, and neither does the pin bar. Testing it on a demo account before going live can help traders understand the pattern and become more familiar with how the pin bar candlestick behaves under different market conditions.
Are you Ready to Explore the World of Trading?
Disclaimer: The information provided on this blog is for educational/informational purposes only and should not be considered financial/investment advice. Trading carries a high level of risk, and you should only trade with capital you can afford to lose. Past performance is not indicative of future results. We do not guarantee the accuracy or completeness of the information presented, and we disclaim all liability for any losses incurred from reliance on this content.